Understanding the Role of a COMTRADE Viewer in Modern Power System Analysis
Posted by Pro Edison
Filed in Business 236 views
Making Sense of Digital Fault Records
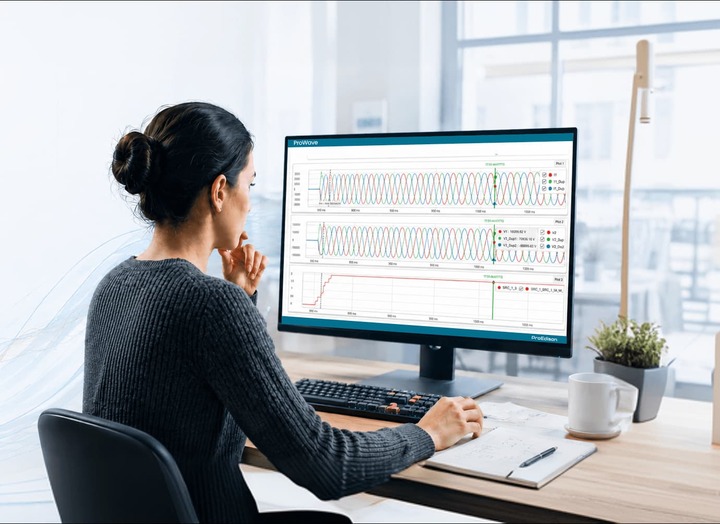
Every time a power system experiences a fault, a switching event, or an unexpected disturbance, protective relays and digital fault recorders capture the moment in painstaking detail. These records hold the story of what happened on the grid, but that story is written in a format most people can't read on their own. This is where a COMTRADE viewer becomes essential. Built specifically to open and interpret Common Format for Transient Data Exchange files, this type of software translates raw numerical data into visual waveforms that engineers can actually study, compare, and act on.
For utility companies, substation technicians, and protection engineers, the ability to quickly load a file and see exactly what occurred during a fault event is not a luxury. It's a core part of daily operations. Manually parsing configuration files and data streams would take hours, and even then, the odds of spotting a subtle irregularity by eye alone are slim. A dedicated viewer strips away that friction, letting professionals focus on diagnosis rather than data wrangling.
What makes this category of software particularly valuable is its consistency across manufacturers. COMTRADE is an internationally recognized standard, which means fault data recorded by one brand of relay can be opened and analyzed using a viewer that has nothing to do with that manufacturer. This interoperability is a big part of why the standard has stuck around for decades and why demand for reliable viewing tools continues to grow alongside the expansion of smart grid infrastructure.
The Everyday Challenges of Fault Analysis
Anyone who has spent time in substation maintenance or relay testing knows that fault events rarely arrive with a neat explanation attached. A breaker might trip for reasons that aren't immediately obvious, and until someone pulls the recorded data and reviews it, the cause remains a mystery. Files can be large, timestamps can be tricky to align across multiple recording devices, and different relay brands often generate configuration files with their own quirks.
These challenges compound when a utility is dealing with an aging fleet of protective devices alongside newer digital equipment. Engineers frequently need to cross-reference waveform captures from several sources to build a complete picture of a disturbance, especially when it spans multiple substations or affects a wide section of a distribution network. Without the right tools, that cross-referencing becomes a tedious, error-prone exercise involving spreadsheets and guesswork.
There's also the matter of time pressure. When a fault causes an outage, customers and regulators want answers quickly. Engineers can't afford to spend a full day manually decoding a data file when the utility needs a root cause analysis within hours. This is exactly the kind of pressure that pushes teams toward software built for speed and clarity rather than generic data tools that were never designed with power system events in mind.
What a Reliable COMTRADE Waveform Viewer Should Offer
A strong COMTRADE waveform viewer does more than simply display a graph. It should let engineers zoom into microsecond-level detail during a fault inception, overlay multiple channels for direct comparison, and toggle between analog and digital signals without losing context. Cursor measurements, harmonic analysis, and the ability to export clean, presentation-ready images are also features that separate a genuinely useful tool from a bare-bones one.
Compatibility matters just as much as functionality. Because COMTRADE files can be saved in different revisions of the standard, from the earliest versions through the more recent ASCII and binary formats, a dependable viewer needs to handle all of them without forcing the user to convert files beforehand. Engineers working across a mixed fleet of relays from different eras and different manufacturers don't have time to troubleshoot compatibility issues on top of everything else.
Usability is another factor that often gets overlooked in technical software. A cluttered interface slows people down, especially during high-pressure investigations. The best tools present waveform data in a clean, intuitive layout, with quick access to channel selection, time-shifting, and annotation features. When a viewer is designed with the end user's workflow in mind, the difference shows up in how quickly a root cause gets identified and documented.
Support for batch processing is worth mentioning too. Larger utilities often deal with dozens of fault records generated in a single event, particularly when multiple relays trip in sequence. A viewer capable of loading and comparing several files side by side saves enormous amounts of time compared to opening records one at a time.
Who Actually Uses This Kind of Software
It's easy to assume this software is only for large utility control rooms, but the reality is broader. Protection and control engineers use waveform viewers daily to verify relay settings and confirm that protective devices are operating correctly. Commissioning teams rely on them when testing new equipment before it goes live on a network. Consultants and third-party engineering firms use them when investigating disturbances on behalf of clients who don't have in-house expertise.
Even academic researchers and students studying power system protection benefit from having accessible tools to study real-world fault data. Understanding how a transformer fault or a line-to-ground event actually appears in waveform form builds intuition that textbooks alone can't provide. As more universities incorporate practical power systems training into their curricula, familiarity with this kind of software is becoming a genuinely useful skill for the next generation of engineers.
Renewable energy integration has added another layer of relevance. Wind farms, solar installations, and battery storage systems introduce different fault signatures than traditional generation sources, and engineers analyzing these newer assets depend on the same underlying tools to make sense of unfamiliar waveform patterns.
Choosing the Right Tool for Long-Term Use
When evaluating options, it helps to think beyond immediate needs and consider how a tool will hold up as a utility's equipment mix evolves. Software that receives regular updates, supports a wide range of file revisions, and offers responsive technical support tends to hold its value far better than something built for a narrow use case. Engineers should also weigh how easily a tool integrates into existing workflows, since a viewer that requires constant workarounds ends up costing more time than it saves.
Cost is naturally part of the conversation, but it shouldn't be the only deciding factor. A cheaper tool that lacks proper support for newer COMTRADE revisions or struggles with large files can end up creating more problems than it solves during a critical investigation. Reliability, in this line of work, is worth paying for.
Ultimately, the goal of any fault recording analysis tool is to remove uncertainty from an already stressful situation. When something goes wrong on the grid, engineers need answers they can trust, delivered quickly and clearly. Software built specifically around this need, rather than adapted from generic data visualization tools, consistently proves to be the better long-term investment for teams serious about keeping their networks reliable.